~15%
Shorter tickets at Chili’s
Its POS and KDS product owner attributed the change to live counts that show cooks what to prep next.
Crunchtime operator reportCustom kitchen display systems
Serve more orders during the rush, get pickups out on time, and spend less on remakes. See what those gains could be worth for your kitchen.
Published vendor case studies
~15%
Its POS and KDS product owner attributed the change to live counts that show cooks what to prep next.
Crunchtime operator report90s–2m
Its CEO reported the reduction after introducing Toast KDS as part of a rollout that included handheld POS.
Toast case studyKDS ROI calculator
Would a kitchen display pay for itself? Start with the savings you can count on, then see how many extra orders would cover the rest.
Estimated return
$440net change per month
Enter a valid number in each field to see your estimate.
Extra sales multiply extra paid orders by the average sale.
Monthly change adds remake and payroll savings to what you keep from extra orders, then subtracts the monthly system cost.
Payback divides setup cost by a positive monthly gain. The one-year target assumes the same results each month.
Example in USD for a venue with 1,000 paid orders a month. Order growth options are what-if scenarios. Replace costs with your own estimates.
Pick one recurring problem. We’ll check what your current POS can handle and measure the change across comparable shifts.
Show the crew which tickets are due next and where they’re waiting.
Put requests like “no scallions” next to the dish at the station making it.
Show the person packing the order what’s still missing and when it’s due.
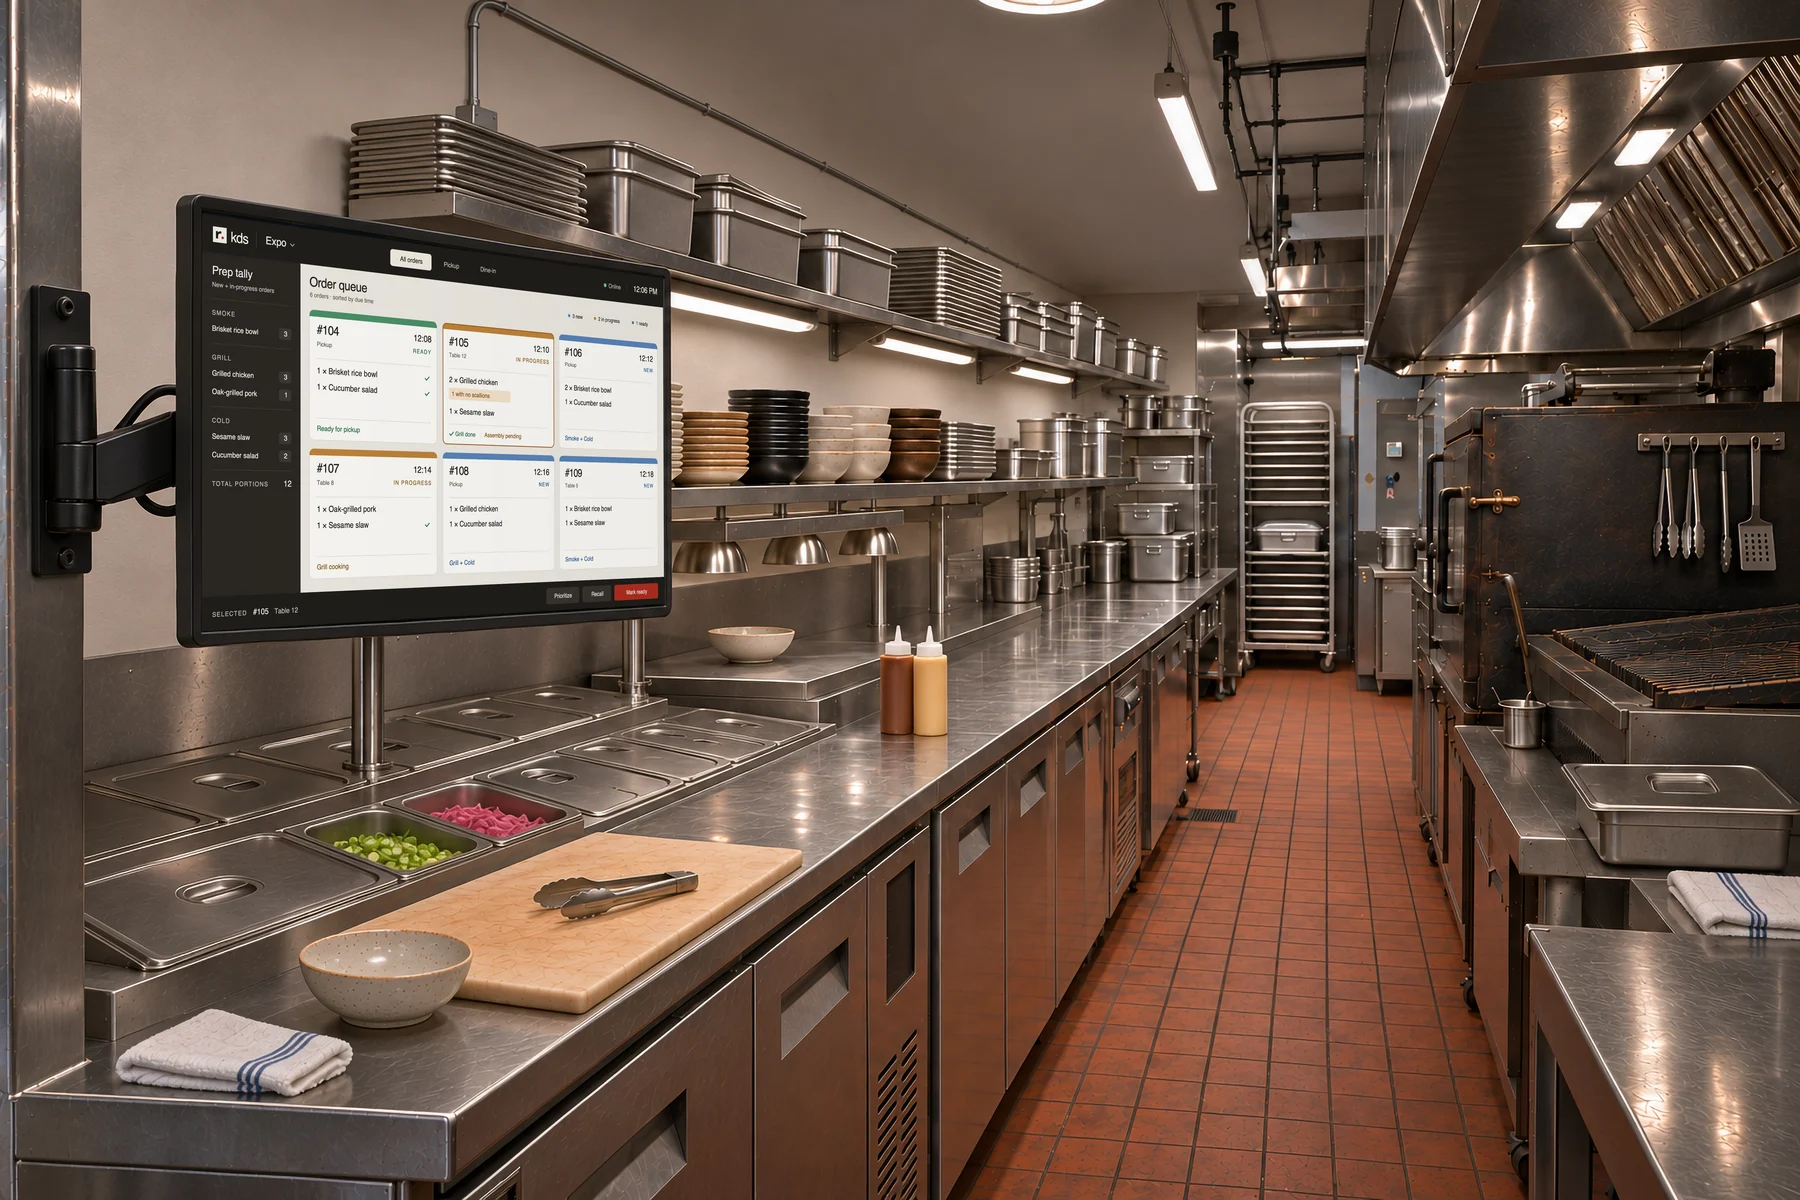
Expo interface concept
Order 105 is due soon. Grill is done and assembly is still working. The expediter knows where to check before the order goes late.
Open the full screen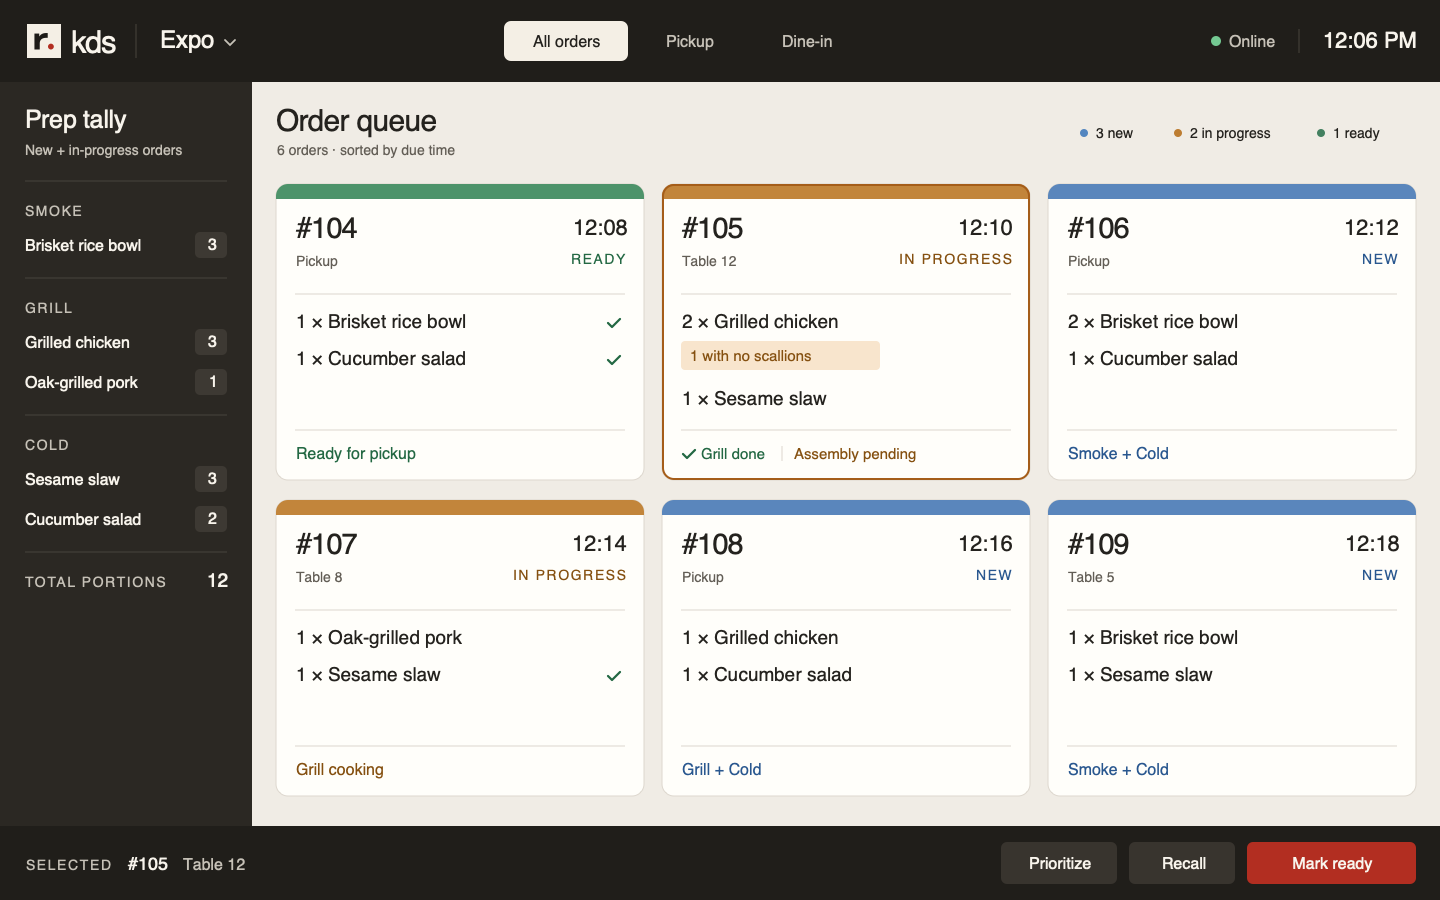
Bring a sample ticket, your station layout, and your POS. We’ll identify a bottleneck, check the integration, and agree on what to measure before you invest.